Let’s register a very good news first: in US we have 2 days in row with less than a 1000 deaths. Why I do not see this on the front pages? On May 11 US reported 733 deaths and on May 12 in USA reported and 853 deaths. We didn’t have that since April 2.
A historic fight to re-open the Western world is continuing, but the more you test, the more cases you will detect. So, let’s support the unconditional re-open of the World as we know it. On April 29, Elon Musk said that orders to stay home are ‘fascist’ (CNBC).
As of Monday, April 27 the world no longer put the virus into its focus. It is hardly reached front page titles. Many countries didn’t even bother to report their numbers over the weekend. Numbers for both cases and deaths to a very low levels. Spain even reduced the number of previously reported cases by 14K. Everyone is tired of this old news. Please, let people return back to their lives.
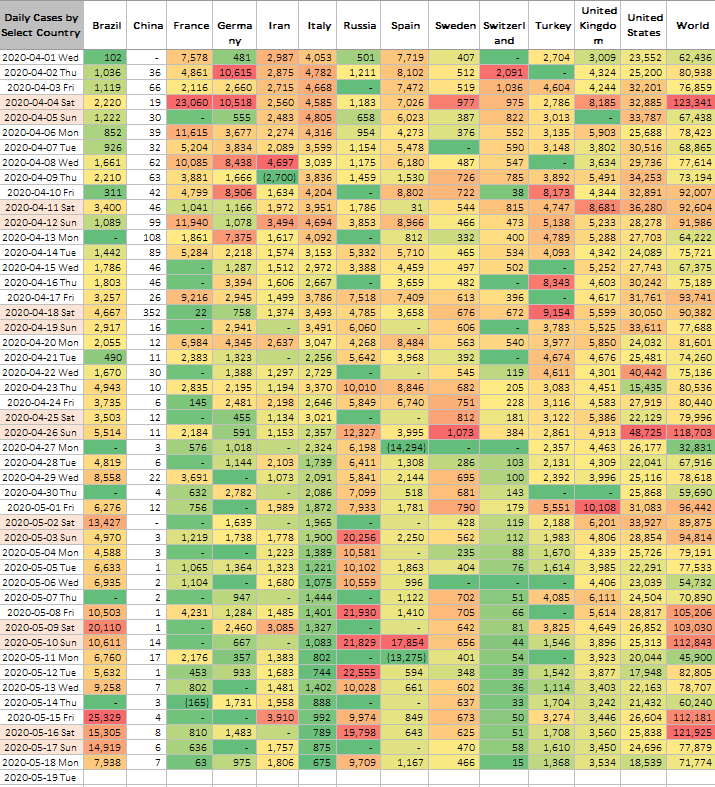
Let’s start with daily new reported cases. The main theme to notice here is that not all countries are reporting regularly, and next day numbers are distorting the true peaks. For example, Russia reporting 10K new cases on April 23, although in reality this is the amount for 2 days.
Italy is the best, most inspiring example. Quietly and without a fuss Italy went from 5-6K new cases a day to 1-2K a day in one month. Steady, stable, confident.
In France the new cases a sow low -less than a thousand a day – that they don’t even report them every day. They passed the peak around April 4.
These numbers show if virus spread speeds up or slows down. Green color indicating less deaths and red indicating more. Data is based on Johns Hopkins University numbers.
Please look at at much more telling 7-day rolling average of reported cases:
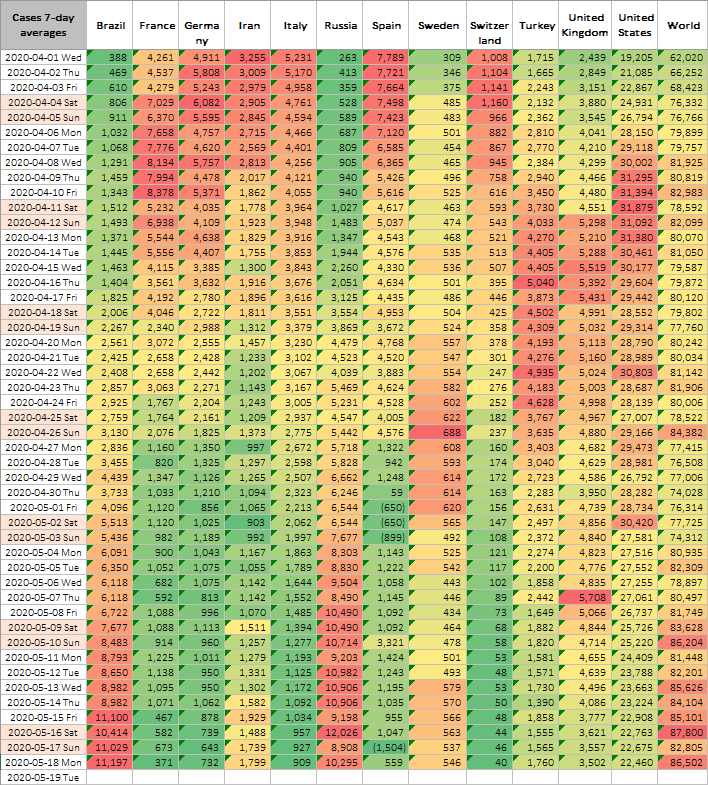
This is a much more representative picture that eliminates erratic gaps in weekend reporting. It clearly shows what stage of epidemic each shown country is at.
We added columns for Russia and Sweden for 2 reasons. Russia is behind the rest of the western world in experiencing the virus. And isolation measures in large cities are draconian. But it still have to go through the same nerve-racing curve. On the contrary, in Sweden Government boldly refused to introduce isolation measures and they manage quite nicely – they are an example for all Western world. We see a familiar pattern and that was achieved without ruining the economy and people’s lives.
Italy shows the the most telling picture. Number of deaths peaked at 919 on March 28 and then slowly went down to around 450 per day and stays at that level. France went from 1.4K deaths on peak days to 400 deaths per day. Even UK reporting only 600 deaths a day – way below 800-900 10 days ago.
USA also reporting only 1.8K – much less deaths per day compared with peak days of April 16 (5K) and 18 (4K). Le’t do not attribute the success to isolation. We need studies to do that. But people are walking in the parks and finally spending time with their kids in record numbers.
As a point of reference, more than 38,000 people die every year in crashes on US roadways. It means 104 people killed on the road in US every day including weekends and holidays.
Iran deaths are now below 100 per day. They rested on Sunday, April 19, and reported 173 for both Sunday and Monday. This is another very promising pattern.
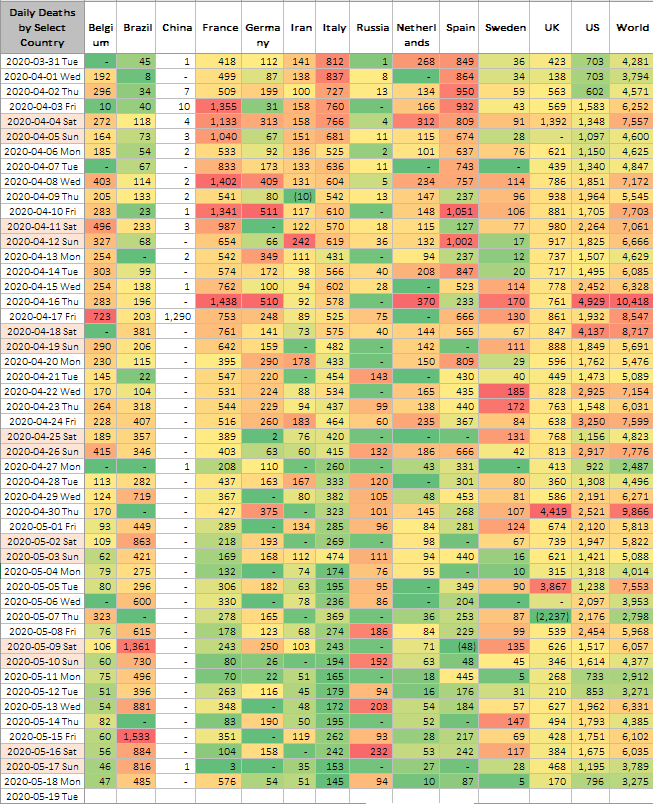
Here are the daily death numbers for countries with most SARS-CoV-2 related deaths.
There are plenty of things to celebrate on Monday, April 27. Italy reported only 260 deaths – by fay the lowest number since we started to monitor the situation on March 20. Even USA reported less than a thousand deaths despite desperate attempts to keep the hype up. Total world deaths back to levels not seen since end of March.
Why countries do not show us total daily deaths in 2020 compared with total daily deaths in 2019? For example, in US about 8,000 people die every day. So, 1.751 flu-related deaths this time of the year is it normal of high? Just show us the numbers and let us decide.
Here are the same numbers smoothed with 7-day rolling average:
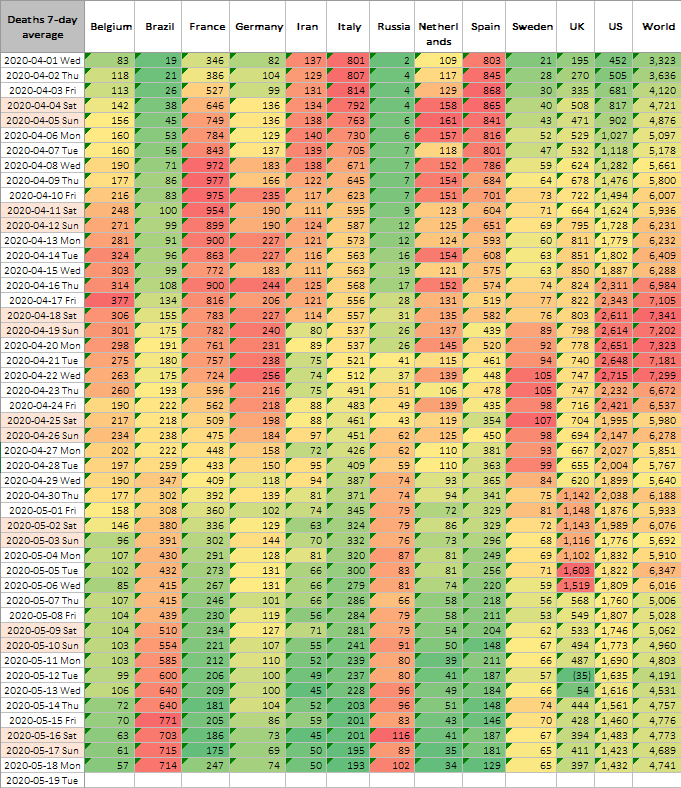
Peaks in daily deaths are mirroring peaks in daily cases reported. Daily US deaths are one third of World daily deaths, so not wonder that US death peak coincides with World death peak around April 22.
On April 17, China suddenly reported a significant number of deaths. Most likely reason is an erratic reporting. They found a box of month old cases and finally were cleared to report it. Meanwhile, the number of new cases in China for that day was 26.
On April 30, UK suddenly reported 4,4K new deaths, and its death rate jumped to 16.2% – highest among monitored countries.
On April 9, Iran reported negative 10 deaths from the virus.
Death Rate
Based on these numbers, total death rate was slowly creeping up. Now it stabilized at about 7% in the world. In China death rate appears to stabilize at 4.1%. World death rate is higher. In March it was growing from 4.2 to 4.9%. In April it grew from 5.0% to 6.6% (for all countries combined). In US the death rate have also grown. On March 21 virus death rate was 1.3%. On April 16 it is 4.8%. US death rate now stabled at 5.7%. But it is lower that in other European countries except Germany (3.7%).
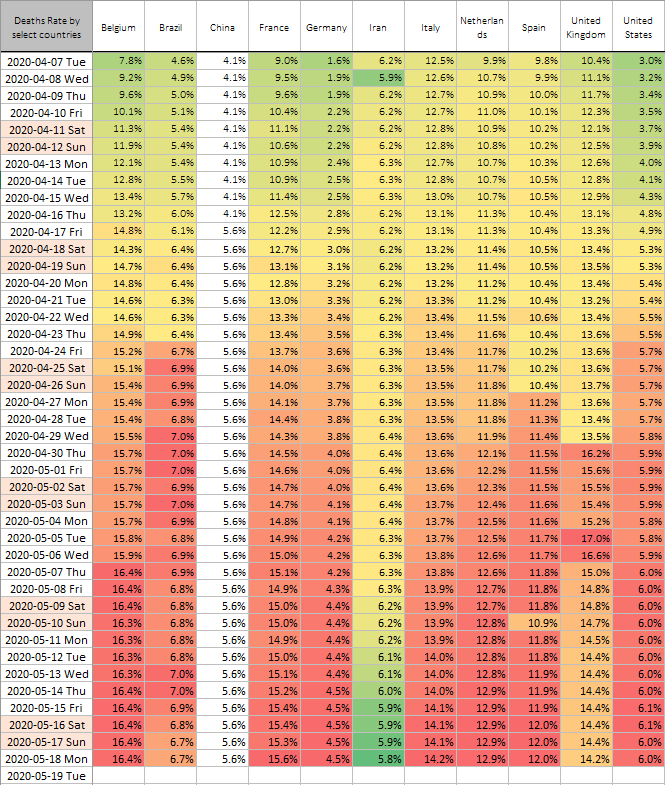
Death rate in China jumped on April 17 when China suddenly reported 1,290 deaths instead of usual 1 or 2 per day.
Death rate in Spain jumped slightly on April 27 because they reduced the number of cases from previous day by 14,2K.
Tracking COVID-19 – Coronavirus – SARS-CoV-2 – Pandemic
Be the first to comment