Under severe pressure from public, CDC finally released total number of deaths from all causes in the US in 2020. As of August 31 the total number of death in the US is 1.8 mil.
https://www.cdc.gov/nchs/nvss/vsrr/covid19/index.htm
Reading the fine print, it appears that 1.8 mil only includes deaths for the period from Feb 1 to August 31. So, 7 months. Let’s give them another discount – let’s say only half of August deaths reached the counting clerks. Let’s just say that we have only 6.5 months of data. Based on this, how many deaths we have on average every month in 2020. We will divide 1.8 mil on 6.5 months. That gives 277K death every month so far.
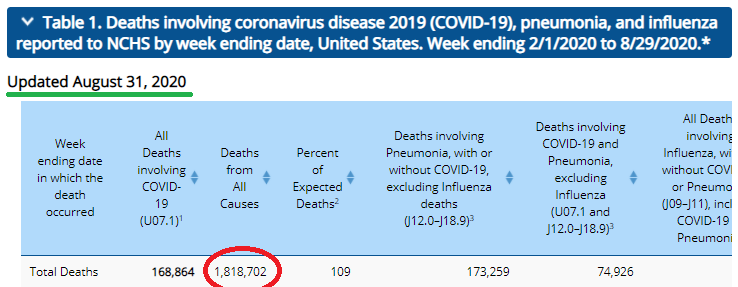
For comparison, the total number of deaths in US for 2018 was 2.8 mil – 2,839,205 to be exact.
https://www.cdc.gov/nchs/products/databriefs/db355.htm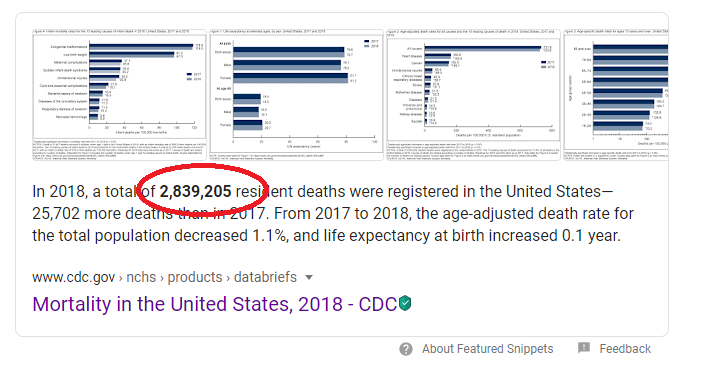
How many people died on average in 2018 every month? 2.8 mil / 12 months = 233K deaths every month.
What is the monthly percentage increase of deaths comparing years 2018 and 2020? It will be 277K monthly deaths in 2020 divided by 233K monthly deaths in 2018 = 19% increase.
This calculated number of 19% increase is an absolute maximum of deaths that we can expect by the end of the year 2020. This rate – 277K deaths per month assumes that people died at this rate in January, which they are not. First US COVID related death was in the middle of February. It also extrapolates deaths rate of March-June into renaming months of 2020 which is problematic. This 19% increase will turn expected 2.8 mil of US death into 3.3 mil. Yes. Tragic. Yes. Significant. But far too small to make Globalist and fear-mongers happy.
However, if we look one more time at CDC own calculations (first link in this article), we will notice that they already calculated the death increase this year vs. death rate from 2017-2019 data, and it is 9% increase:
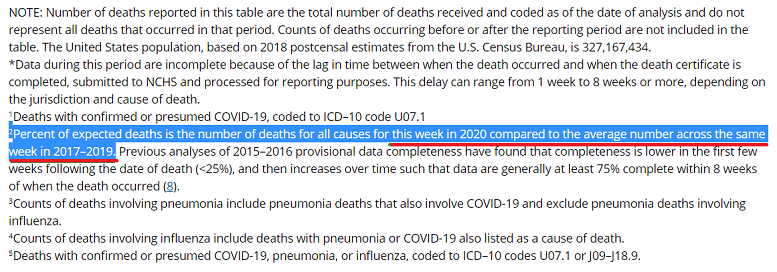
Highlighted note 2 says: “Percent of expected deaths is the number of deaths for all causes for this week in 2020 compared to the average number across the same week in 2017–2019.”
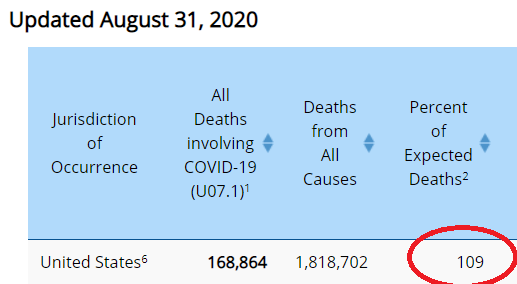
Number 109 indicates that it is a 9% increase in total number of deaths as reported on August 31, compared with the total number of deaths reported for the same period in 2017-2019. That 9% increase will turn 2.8 mil expected deaths by the end of the year into 3.05 mil. It means that by CDC own estimates, based on data as of August 31, 2020 we will have about 250K more deaths in 2020 compared with previous years.
How should we look at that number – 250K? Leading causes of deaths in US are heart disease and cancer. From these two killers alone 1.25 mil Americans die every year (see 2017 numbers below). Do we close butcher shops? Do we stop sugary drinks factories? Do we call a war on high fructose corn syrup? Do we prohibit pesticides and hormones in our foods. The answer is emphatic NO. Why? Because weak and sick population is a very profitable crowd. They always eat processed foods and always require expensive medication. And now a new source of income was invented – a mandatory vaccination for all. Please tell me, who is the master-mind here?
USA – Causes of Death |
2017 |
| Diseases of heart | 647,457 |
| Malignant neoplasms (cancer) | 599,108 |
| Accidents (unintentional injuries) | 169,936 |
| Chronic respiratory diseases (asthma, lung diseases) | 160,201 |
| Cerebrovascular diseases | 146,383 |
| Alzheimer disease | 121,404 |
| Diabetes mellitus | 83,564 |
| Influenza and pneumonia | 55,672 |
| Nephritis, nephrotic syndrome and nephrosis | 50,633 |
| Intentional self-harm (suicide) | 47,173 |
| Chronic liver disease and cirrhosis | 41,743 |
| Septicemia | 40,922 |
| Essential hypertension and hypertensive renal disease | 35,316 |
| Parkinson disease | 31,963 |
| Pneumonitis due to solids and liquids | 20,108 |
| All other causes | 561,920 |
| Calculated Total | 2,813,503 |
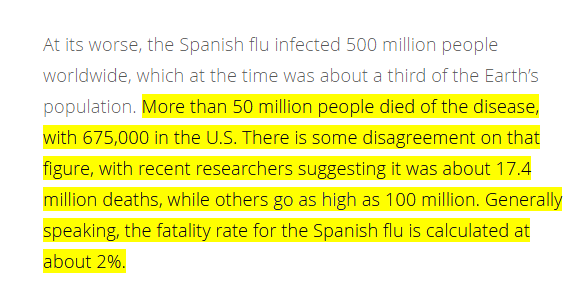
Please remember that Spanish flu of 1918 killed 675K people in US and average age of those killed was 28 years (see links below). According to CDC, as of August 31, COVID killed 169K Americans.
 |
 |
| https://www.who.int/influenza/gip-anniversary/quiz/en/ |
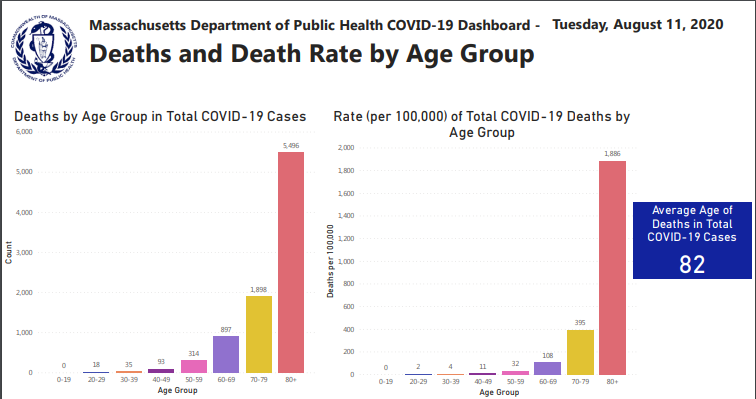
For comparison, the average age of people killed by COVID-19 is 81-82 years. Here is a data from Massachusetts:
https://www.mass.gov/doc/covid-19-dashboard-august-11-2020/download
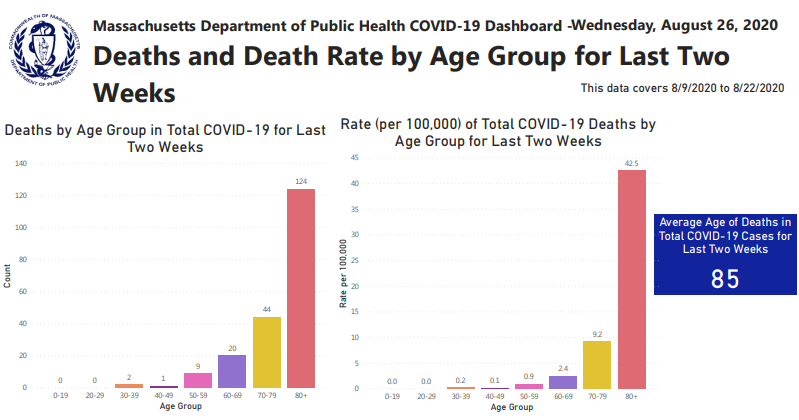
And most resent data from last 2 weeks of August suggests that actual average age of people killed by COVID-19 is closer to 85 year:
https://www.mass.gov/doc/weekly-covid-19-public-health-report-august-26-2020/download
What was all that drama about CDC revising the COVID-19 death toll at the end of the August? Here is what they published on August 26:
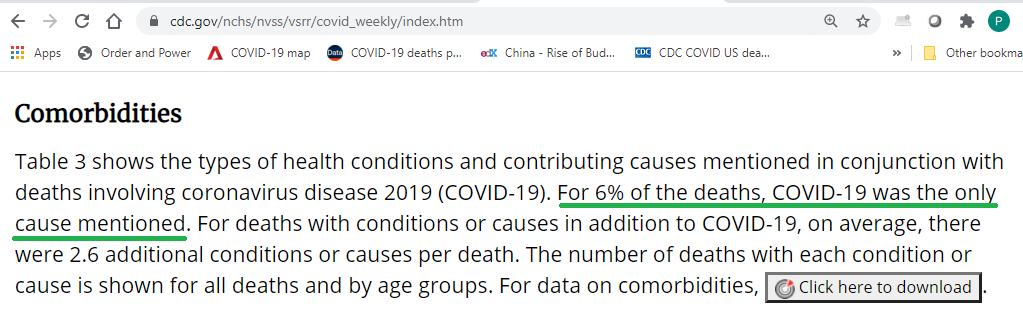
Under section “Comorbidities” (combined causes of death) they wrote:
"For 6% of the deaths, COVID-19 was the only cause mentioned. For deaths with conditions or causes in addition to COVID-19, on average, there were 2.6 additional conditions or causes per death."
https://www.cdc.gov/nchs/nvss/vsrr/covid_weekly/index.htm
As everyone knew already,
if you are meek and weak, your chances are bleak.
But, thank you CDC for finally confirming this common knowledge. Please be aware, that every time media is portraying another terrible COVID-19 death, they omit remaining other 1.6 causes of death like cancer, heart disease, diabetes, etc. Why? Because it will kill the dramatic effect of the story.
However, in the interest of protecting the innocence, here is the final graph that will dispel all your doubts. Remember, how we always demanded to show us the total death picture in USA. I think, they listened. Here is CDC interactive chart that compares week-by-week expected total number of deaths versus actual deaths in US for the period 2017-2020 regardless of causes. They call it “excess deaths“. This is a very clear chart. It is hard to argue with this total deaths figures:
https://www.cdc.gov/nchs/nvss/vsrr/covid19/excess_deaths.htm
[chart updated as of September 22, 2020]
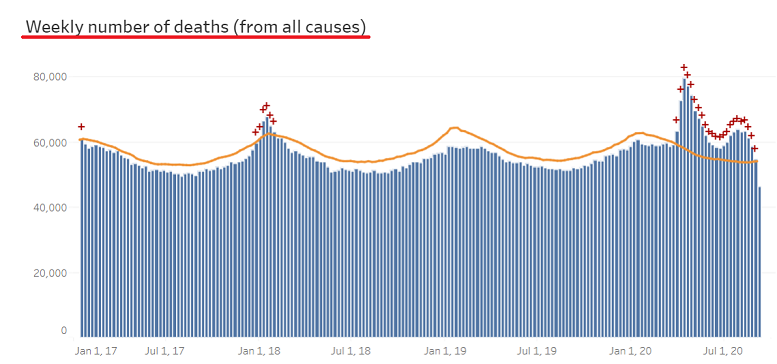
You can click on any weekly bar and see the exact number of deaths for this week compared with expected number of deaths. That is how you present your data. That is a complete picture. It might be Government business to close schools and shut down businesses (what?), but CDC is here to report up to the minute data in an earnest and complete manner. I can believe I am say this – good job CDC! We can see that COVID-19 is just a blimp, and it will be forgotten just any other blimp in the history. Now, armed with a complete picture, we have nothing to fear.
So please, use available data. Think. Analyze. Decide.

Be the first to comment