In November 2013 I drew a grid in Excel trying to see any pattern in distribution of prime numbers. After many tries, a very interesting pattern showed up around prime number 41. At one moment, it even seemed that that could be way to generate prime number by a formula. I was postponing to publish this finding until today – 2020-08-28. Please feel free to continue where I stopped.
Here are the findings.
If you place all numbers greater than 41 around number 41 in a swirling fashion and mark with colors numbers that are divisible by 2, 3, 5, 7, 11 etc. you will see something like this:
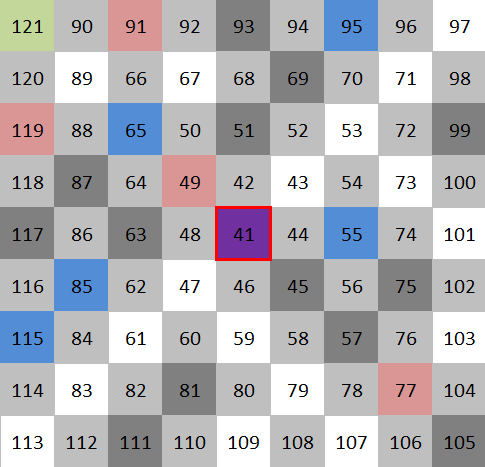
Image above shows how to place the numbers above 41 with a center at 41.
If we mark all number that divisible by 2, 3, 5, 7, 11 etc. with various colors, prime numbers will remain white. Image below shows that north-west to south-east diagonal holds only prime numbers – 43, 47, 53, 61, 71, 83 etc.
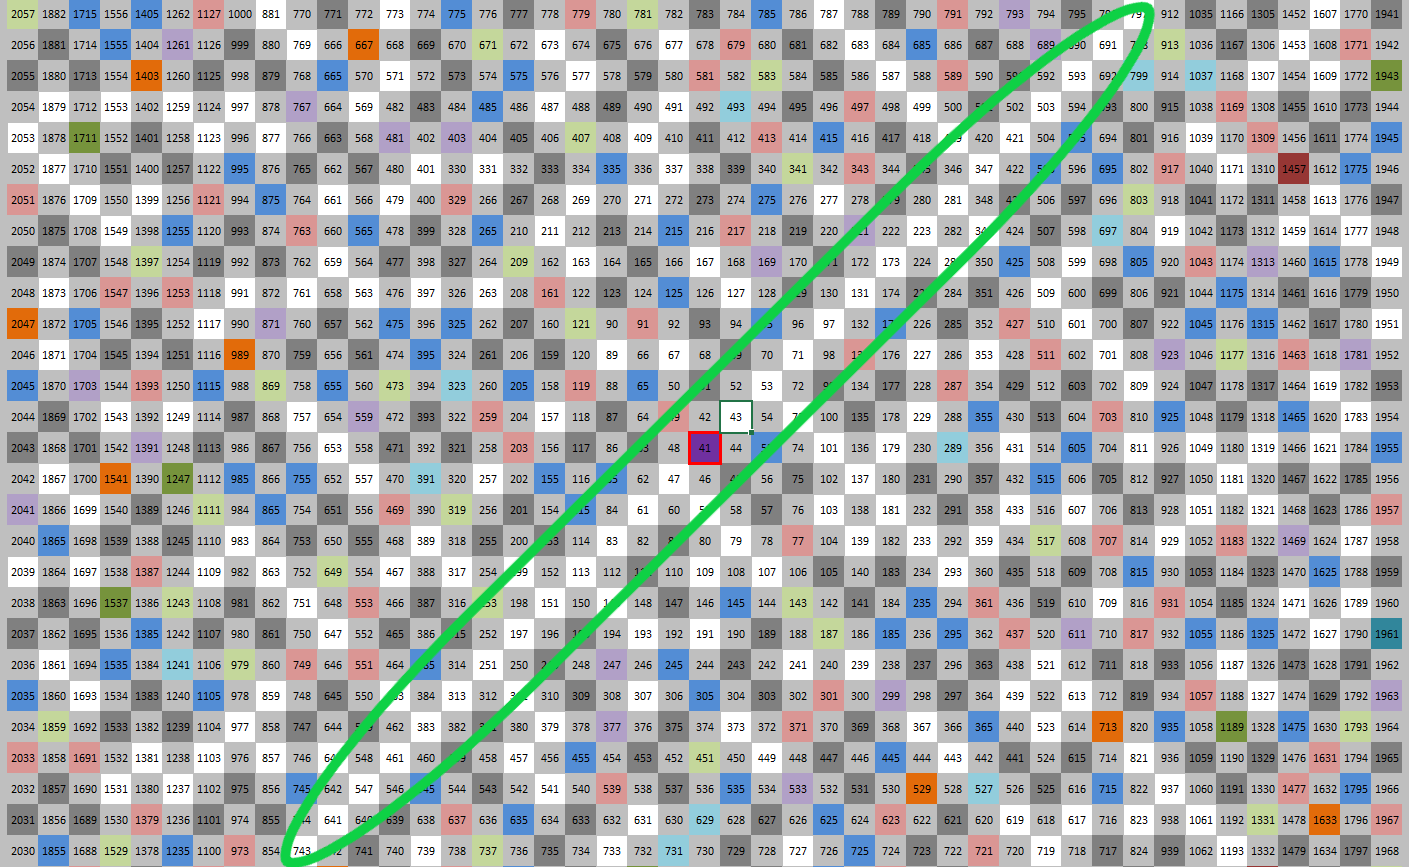
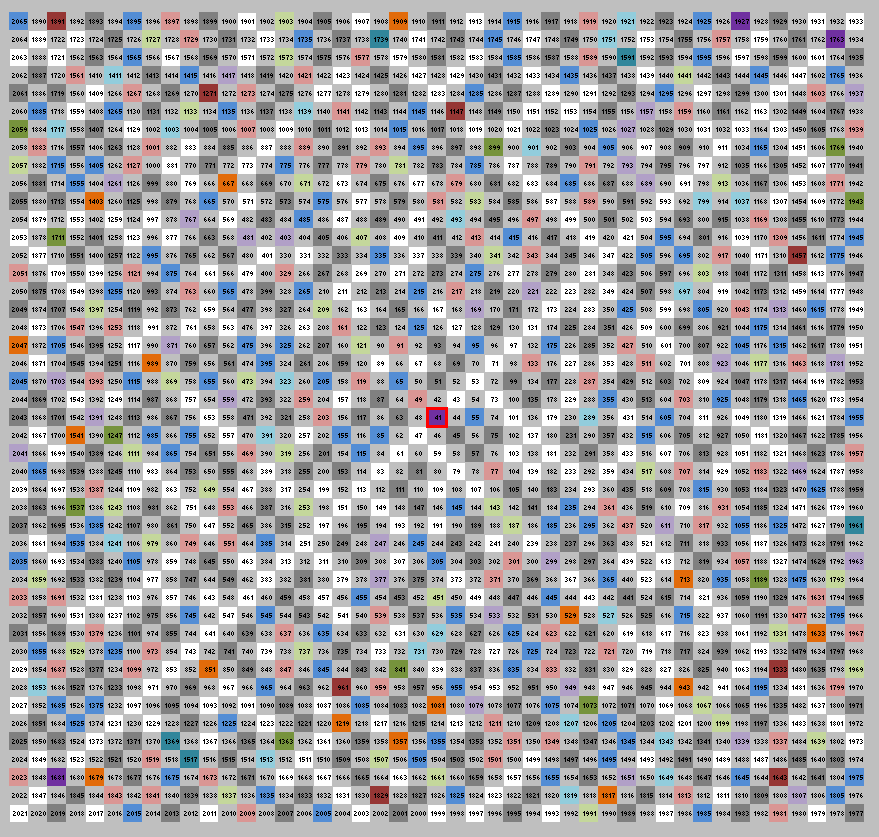
I was stunned for a second. What if I found a recipe for generating larger and larger prime numbers with a simple formula. Unfortunately, no. This pattern breaks at number 1,681. That number represents 41*41.
Questions and clarifications
–01– What is the formula for all the numbers at the diagonal – 41,43, 47, 53, 61, 71? They all generated be adding 2, 4, 6, 8, 10 etc.
–02- What is so special about number 41? It is located -1 from divisible by 3 (42), +1 from divisible by 5 (40), -1 from divisible by 7 (42), -3 from divisible by 11 (44), +2 from divisible by 13, +7 from divisible by 17 (34) and +3 from divisible by 19 (38). The next number with such features will be . . . what?
–03– Anybody has a computing power to investigate the numbers beyond 1681? Does the pattern continues?
Side observation
We marked all the numbers that are divisible by something with various colors. Remaining white cells hold prime numbers. Can we estimate number of cell of various color?
About 50% of cells are divisible by 2 (gray). Example: out of 81 displayed, we should see about 40.5 light gray cells. And yes, we can count 40 light gray cells.
About 16.66% of all cells are divisible by 3, but not 2 (33.3% /2). We should see about 81 * 16.66 = 13.5 dark gray cells. And we can actually count 13 dark gray cells. That is good.
How about blue cells? What percentage on blue cells (squares that are divisible but 5, but not by 2 or by 3) should we see on the board? We take 1/5 of all numbers (20%), and we need to reduce that percentage by numbers that are divisible by 2 (50, 60, 70 etc.) that is 20% * 50% = 10%. We need further to reduce remaining number of cell by 33.33% (45, 75, 105, etc.) divisible by 3. So, number of blue squares should be 20% reduced by 50% and further reduced by 33.33%. I am getting 20% * (100%-50%) * (100%-33.33%) = 6.66% So in 81 numbers display I should see about 81*6.333% = 5.4 blues squares. In reality, I can see 5 blue squares. Good.
May be there is a base for a interesting sequence here. Percentage of all numbers divisible by 2 is 50%. Percentage of all number divisible by 2 and 3 is 50% +16.66% = 66.66%. Making similar calculations, percentage of all numbers divisible by 2, 3 and 5 is 50% +16.66% +6.33% = 73% Imagine, if we start summing up all the numbers consumed by divisible of other numbers (non prime numbers that is), and then we can approximate the number of remaining numbers that got to be prime. It feels that our sum should be slowly approaching 100% and the remaining percent left for prime numbers should be approaching 0%.
Be the first to comment